In the Q2 2021 Private Rented Sector (PRS) Trends report we highlighted how the majority of landlord optimism indicators - measured by asking private rented sector (PRS) investors to rate five different aspects of letting - were at their highest level for a number of years.
Three months on, and a range of factors, including continued strong tenant demand, low levels of rent arrears and stable profitability, seem to have further boosted landlord confidence which has increased year-on-year. In fact, the proportion of landlords who said that they feel optimistic continues to rise, exceeding pre-Brexit and pre-pandemic levels to hit a 5-year high for each of these five key metrics.
This confidence is likely a contributing factor to a decrease in the proportion of landlords who expect to sell property during the next 12 months and an increase in those who plan to expand their portfolios.
We see that buy-to-let remains both an attractive investment choice and an essential component of the UK's housing provision, relied on by millions.
Richard Rowntree
Managing Director for Mortgages
Portfolios
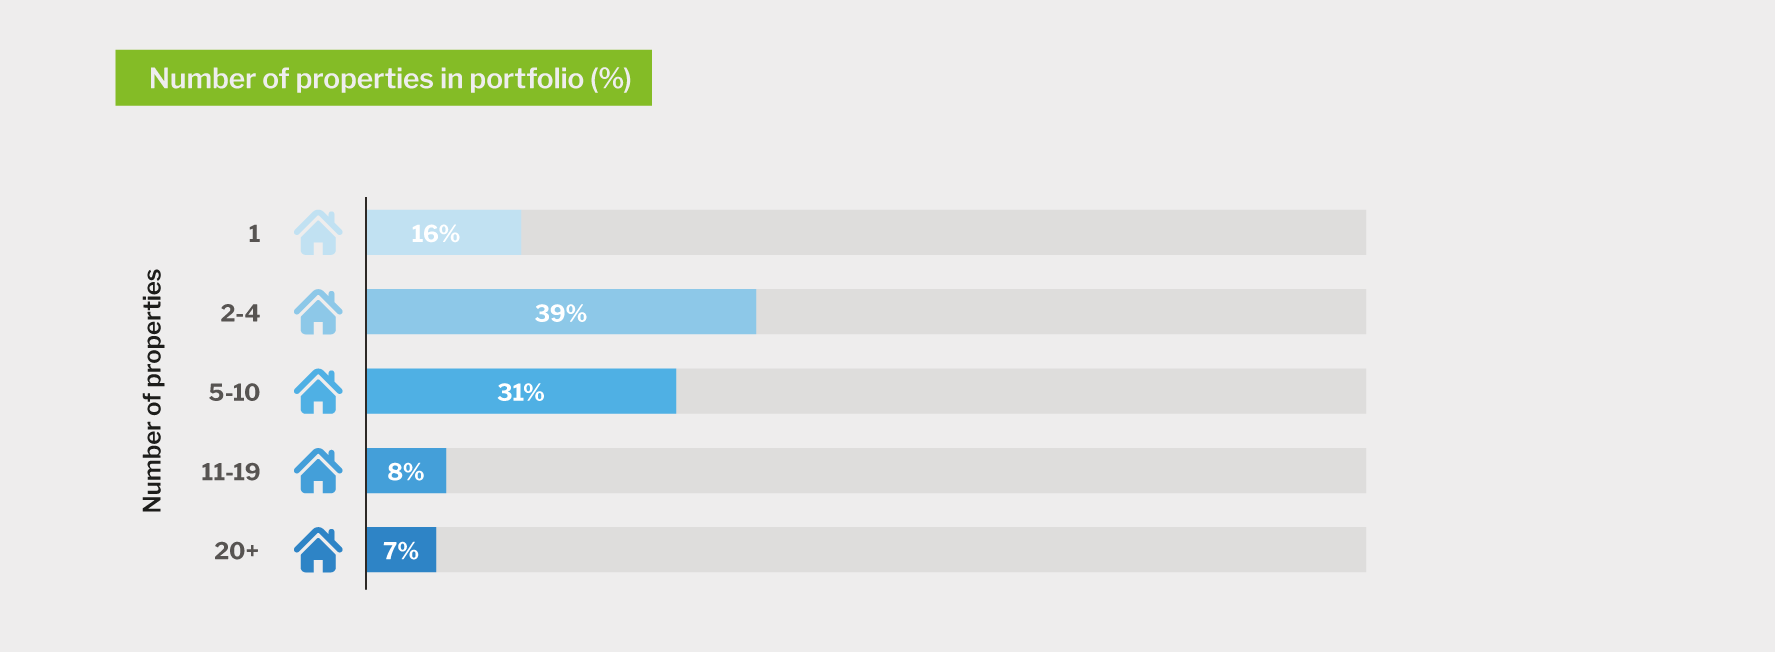
A typical portfolio in Q3 2021 is made up of 6.9 properties, unchanged since Q2 2021. This represents an average of 8.1 tenancies - the number of tenancies higher than the number of properties due to the capacity for some property types, such as HMOs, to house more than one tenancy.
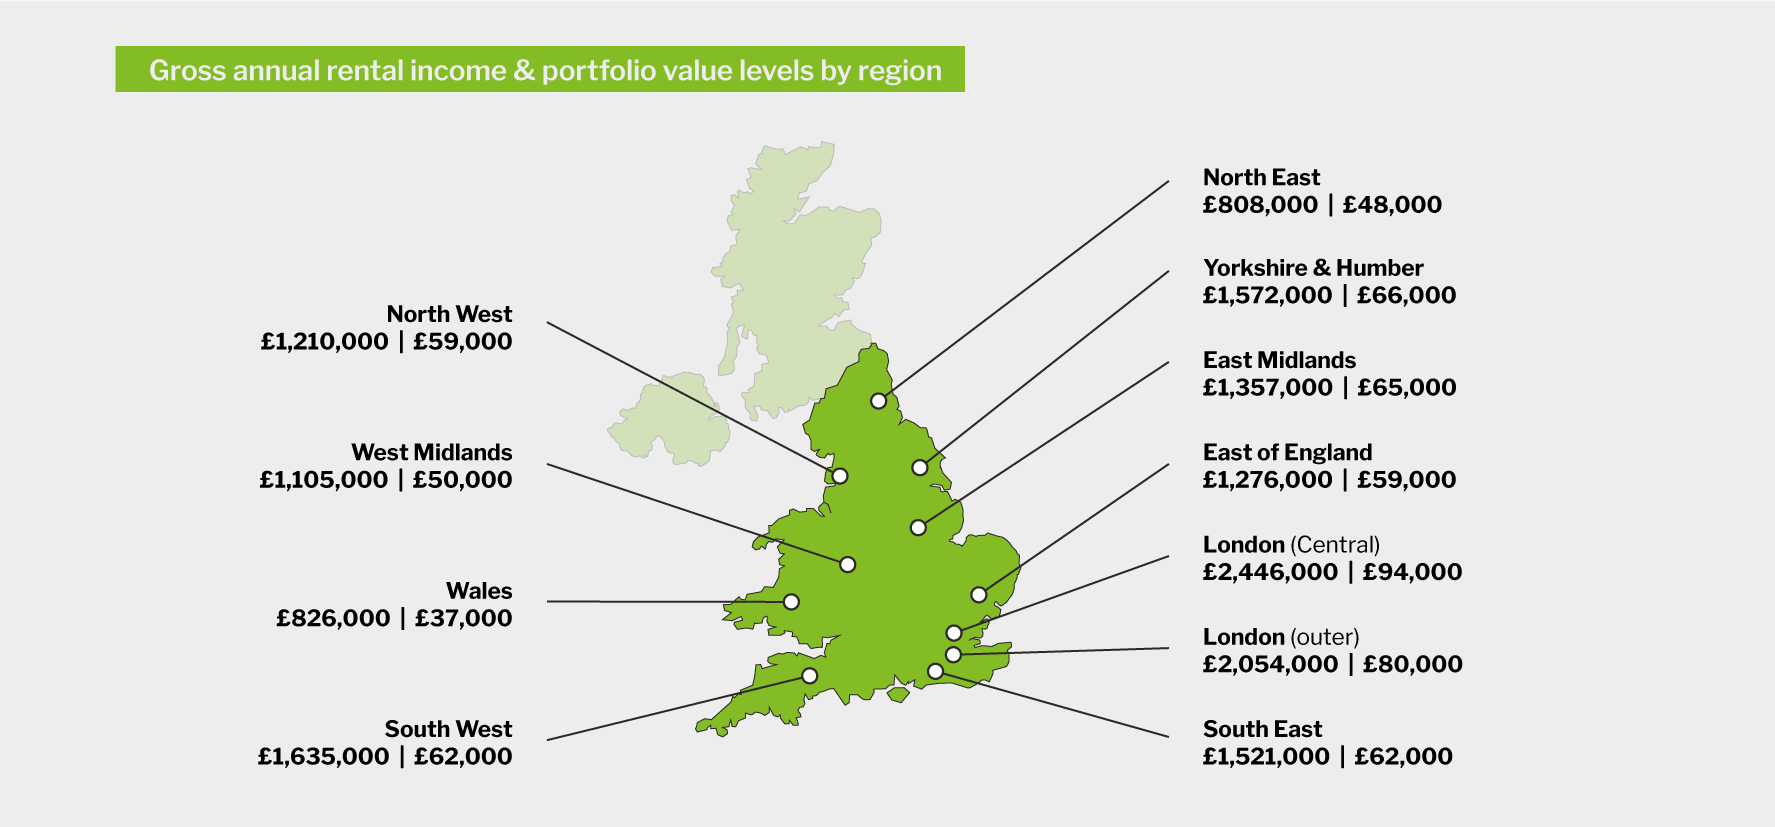
The typical value of each of these properties was £192,173 and they generate an annual income of approximately £8,260 per property, equating to £688 each calendar month.
This results in a typical portfolio being worth around £1.3 million with a gross rental income of £57,000 per annum.
Terraced houses are the most common type of buy-to-let property, with 58% of buy-to-let landlords having at least one in their portfolio. Individual flats are owned by 45% of landlords, the same proportion also own semi-detached houses, the joint second most popular property types for investors.
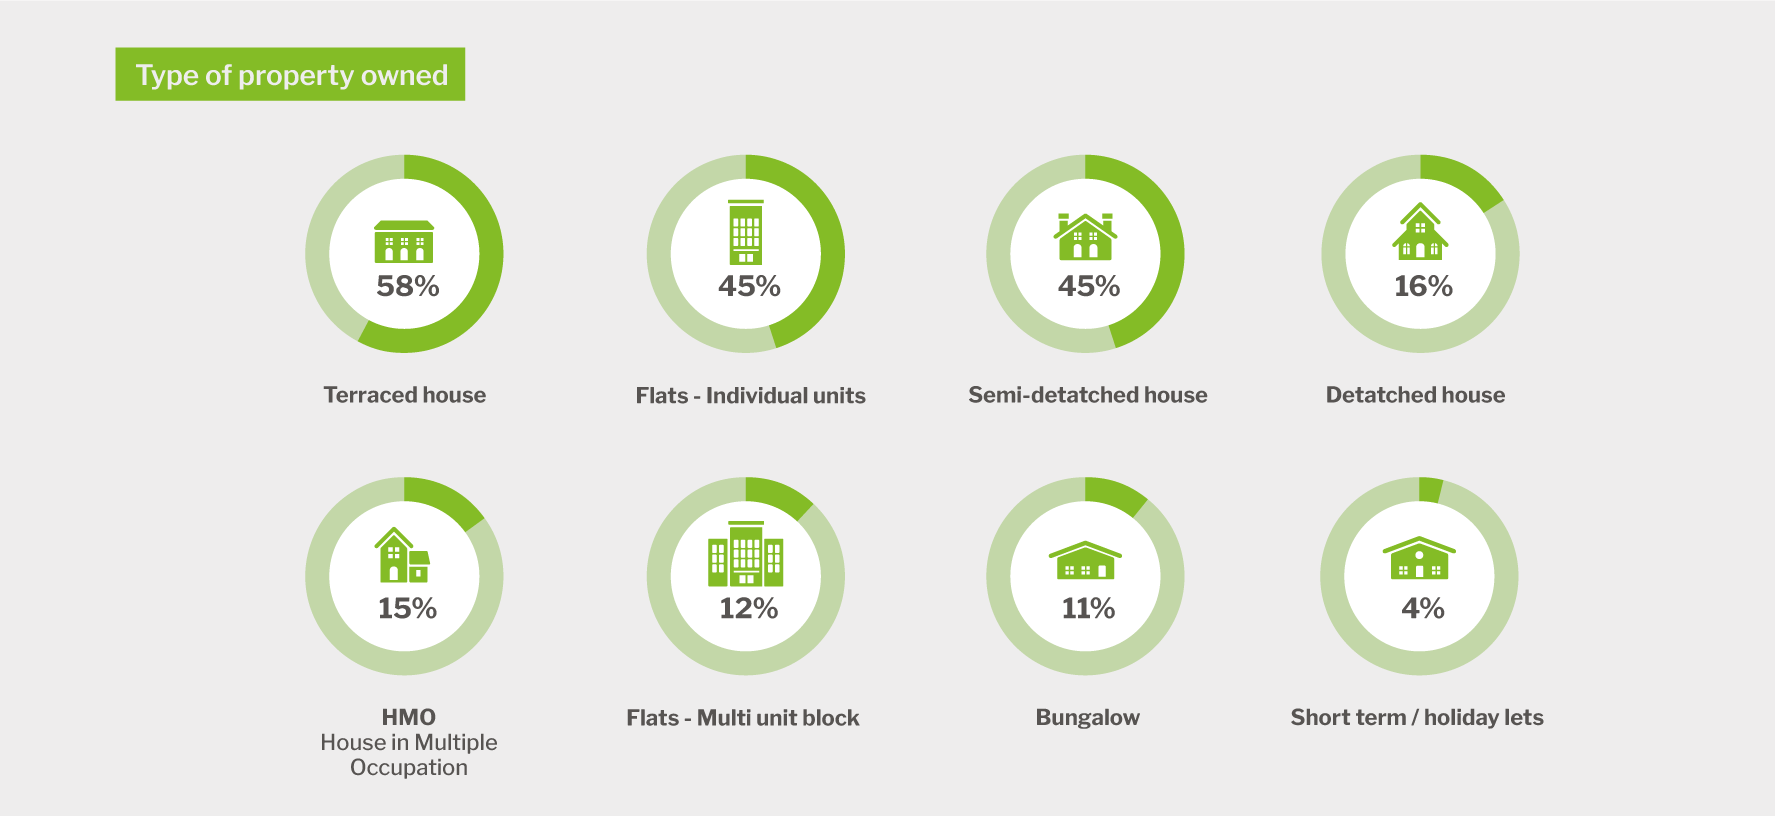
The previously noted observation that larger portfolios are often more diverse in terms of the property types of which they consist, remains - HMOs and blocks of flats, for example, are much more likely to be owned by landlords with 11 or more properties compared to single property landlords.
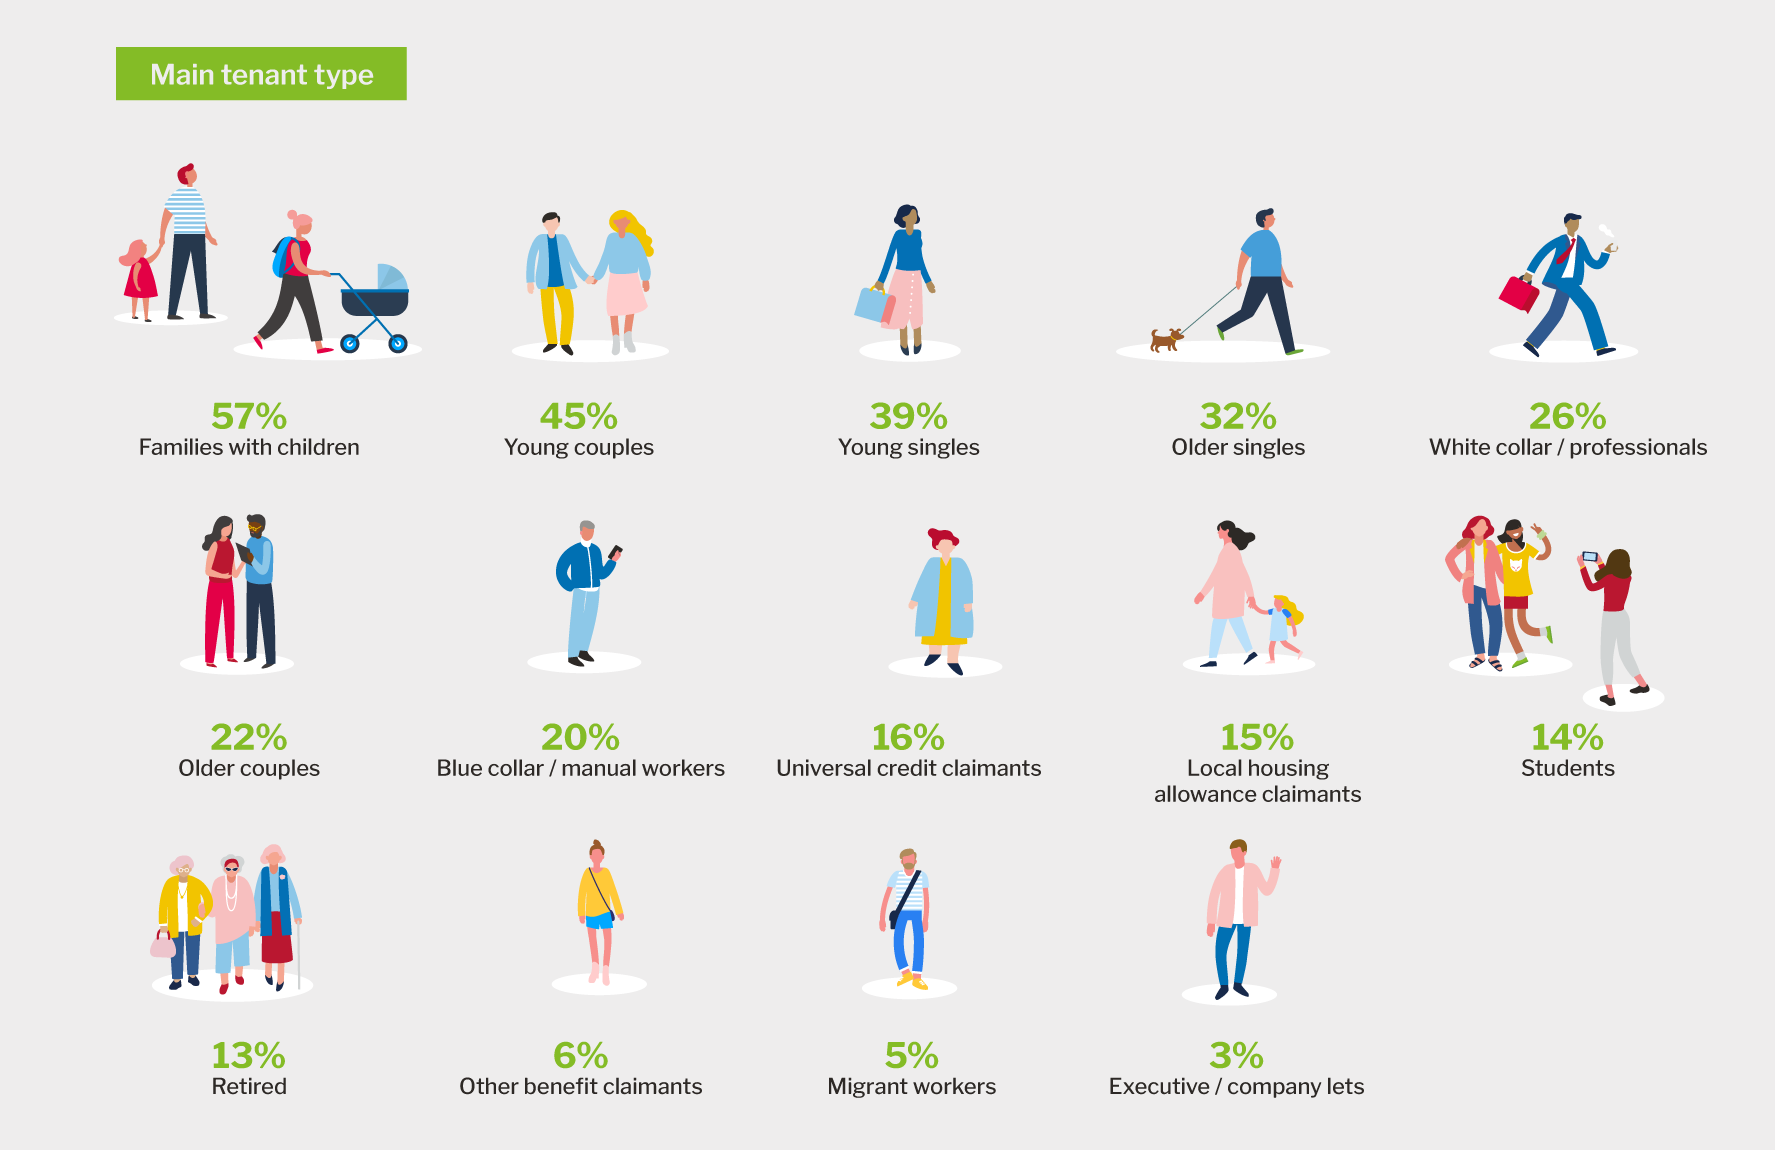
The most common type of tenant group is families with children, increasing by 6 percentage points since last quarter to continue a longer-term trend.
An average of 3.1 different tenant segments is housed by the typical landlord, increasing to 4.1 tenants in the East Midlands, making it the region with the greatest tenant diversity.
Tenant demand
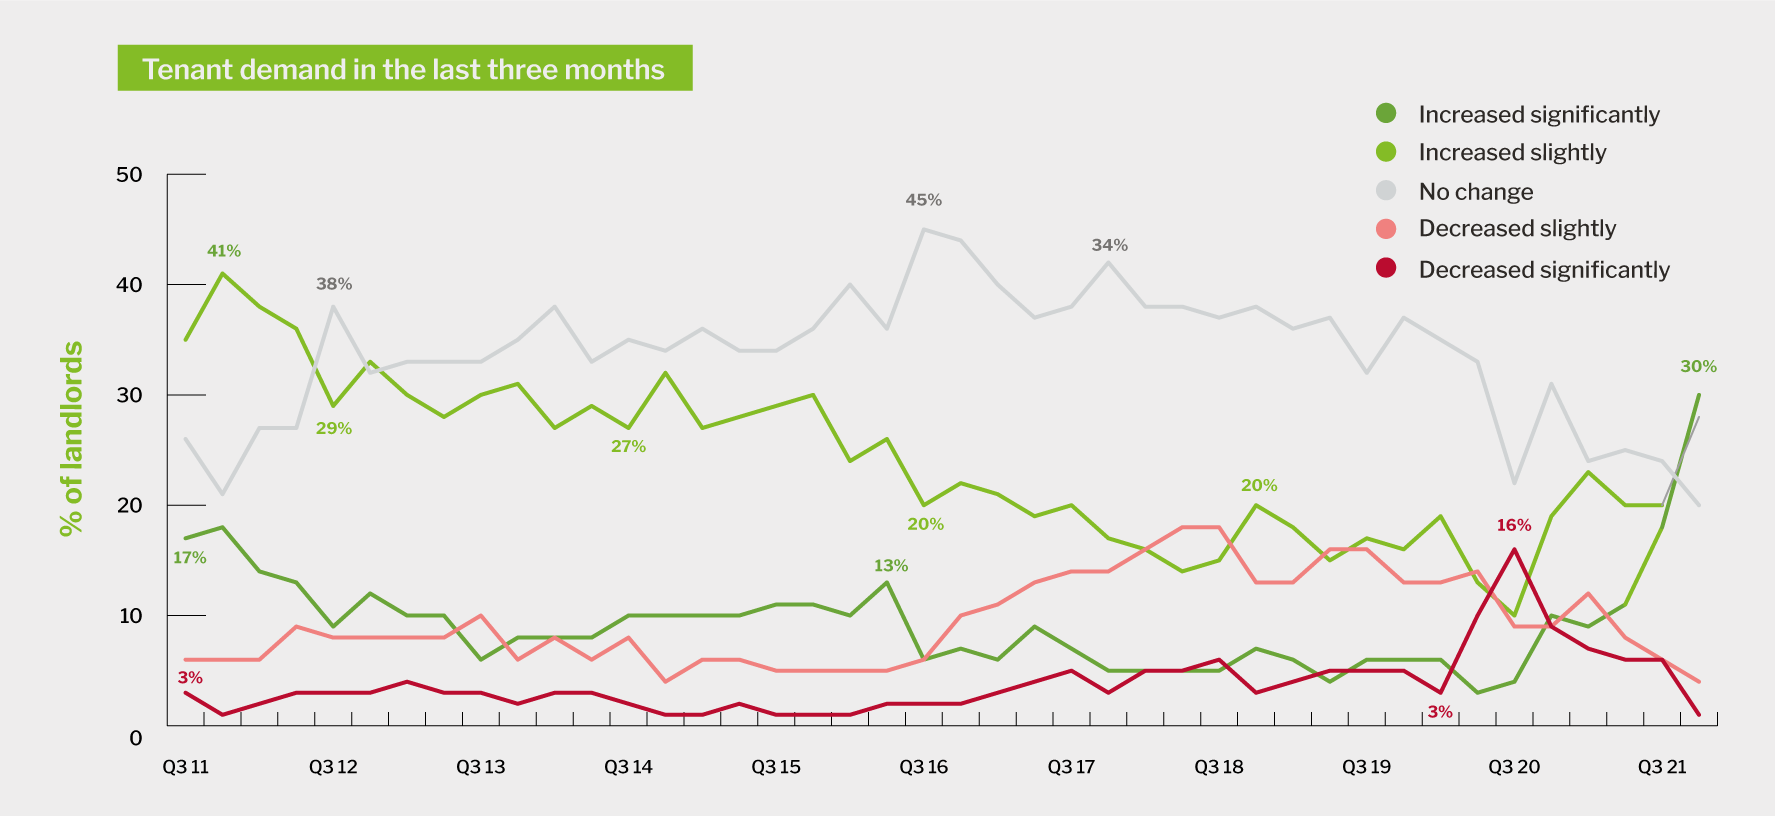
Following on from the 5-year high in the Q2 2021 PRS Trends report, this quarter sees an all-time high in the proportion of landlords indicating increasing tenant demand after just under seven in 10 recorded rises over the past three months.
When excluding those that said that they were 'unsure' what had happened to tenant demand over the past three months, 36% of landlords reported 'significant' increases while a further 33% saw 'slight' increases.
Only 5% of landlords reported decreasing demand, down from 12% since the previous quarter. Decreasing tenant demand is most common amongst those letting property to students (16%) and/or operating in Central London (15%).
Regionally, the strongest levels of increasing tenant demand were seen in the South West and South East (excluding London), where 79% and 74% of landlords reported experiencing it, respectively.
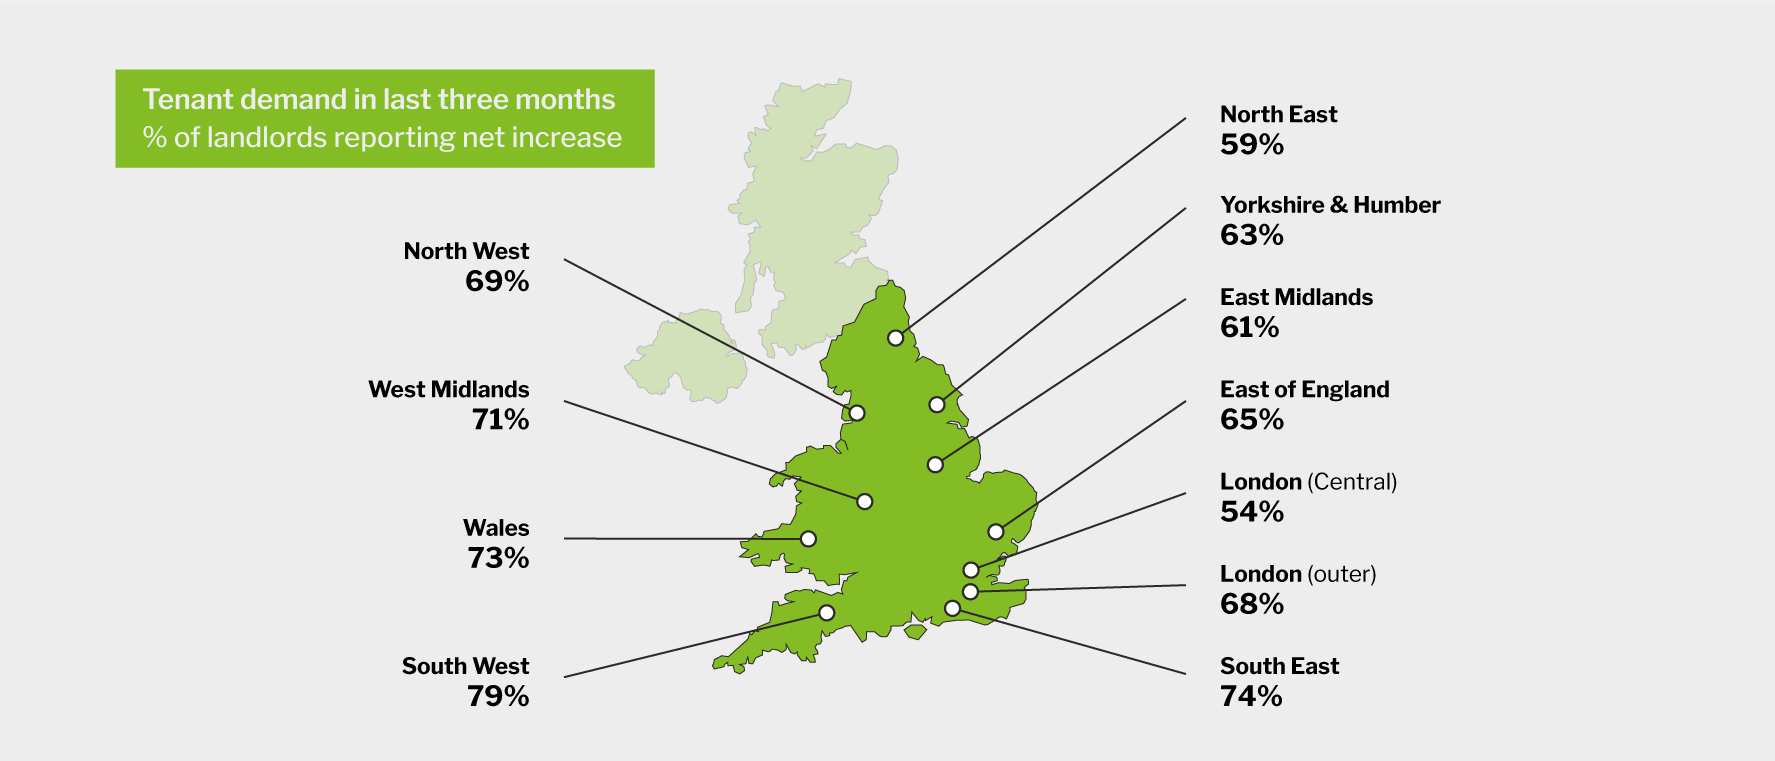
Although still seeing relatively strong levels of interest from tenants, a lower proportion, 59%, of investors with property in the North East indicated experiencing increased demand.
This figure falls to 54% amongst those managing portfolios in central London, in part due to the region seeing the highest levels of decreasing demand (16%). Despite this, the data suggests that a significant shift is being seen in appetite for central London living as people continue to return to the capital - the same period in 2020 saw a net increase in tenant demand reported by just 16% of Central London landlords, while 58% reported demand was decreasing.
Continued strong tenant demand is helping to stabilise voids. This quarter, 28% of landlords experienced a void during the past three months. This is one percentage point higher than the previous quarter but a substantial year-on-year improvement when compared to the 39% of landlords who reported empty properties when surveyed in Q3 2020.
Yield generation
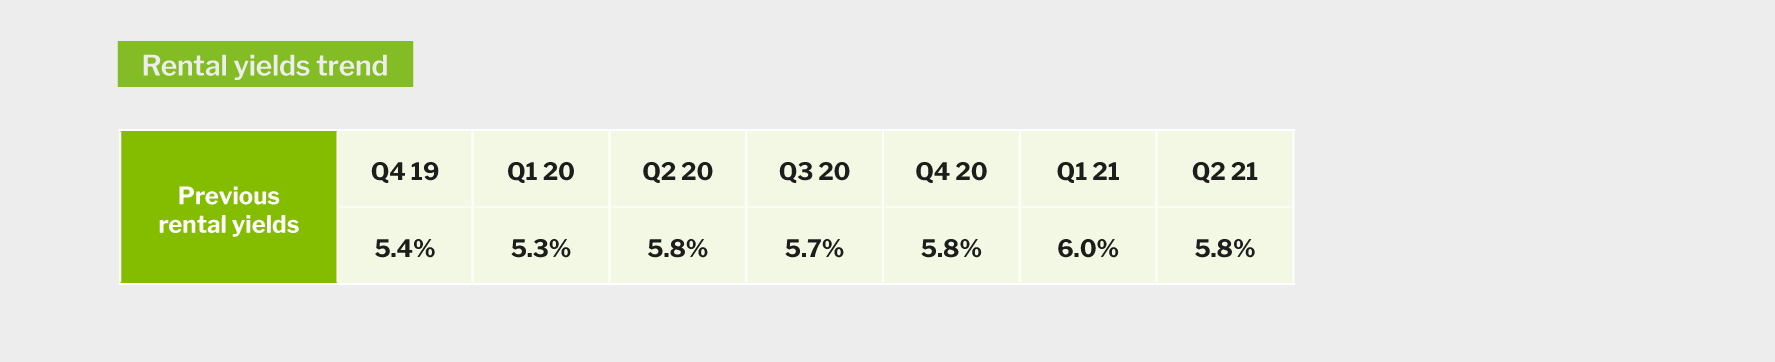
The first quarter of the year saw average yields achieved by landlords hit a 3-year high of 6%. This dropped by 0.2 percentage points to 5.8% last quarter and has risen to 5.9% in Q3 2021.
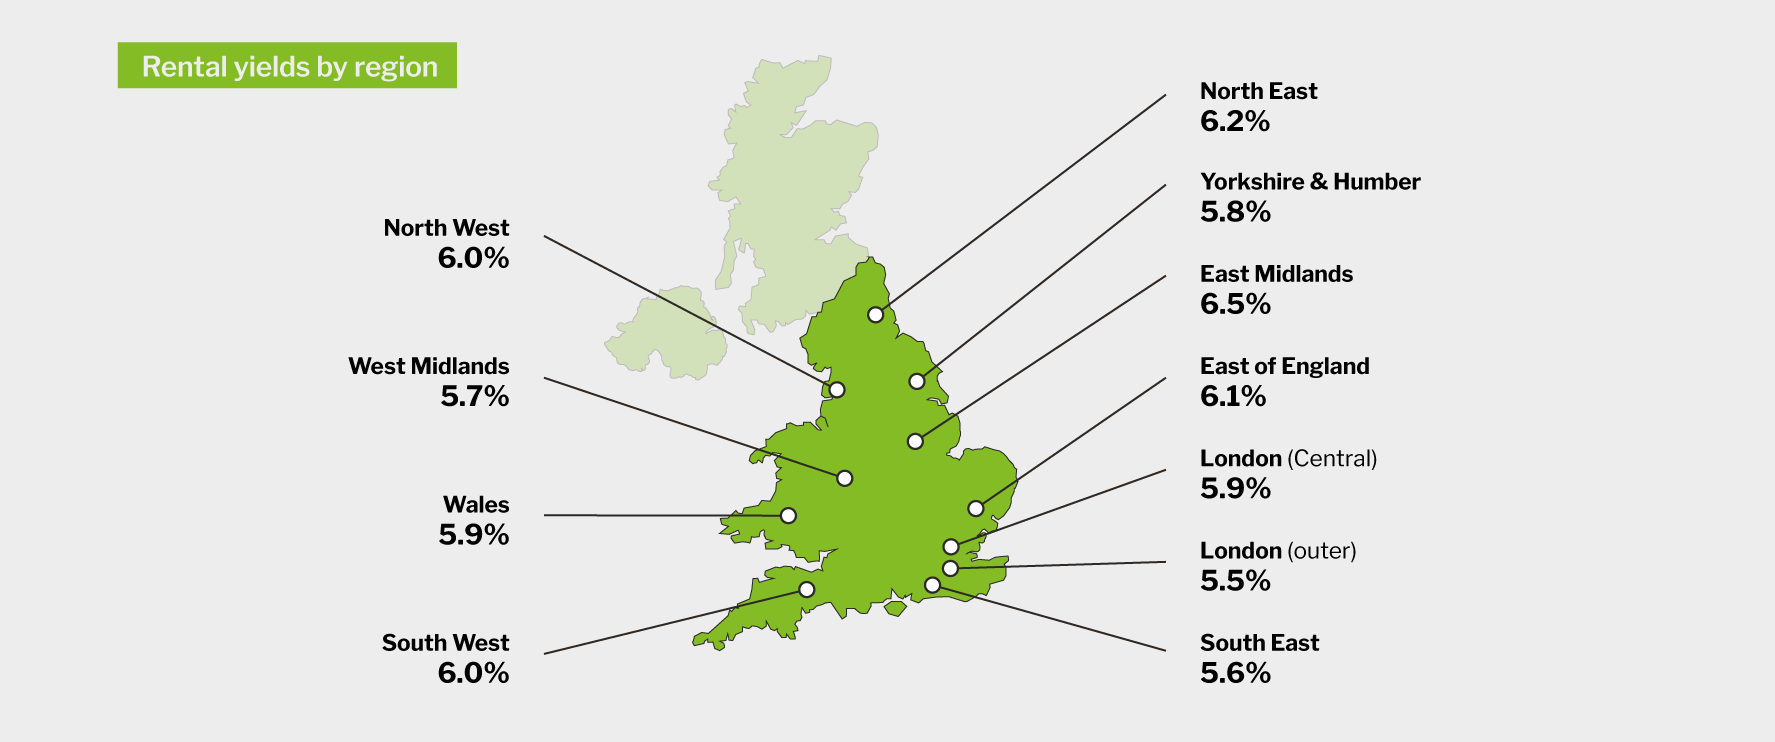
Interestingly, the top three performing regions, in terms of the rental yields achieved by landlords, are all located in the east of England. Landlords operating in the East Midlands reported achieving the highest yields of 6.5%, up from 6.2% in Q2 2021. This was closely followed by the North East and East of England where landlords reported generating yields of 6.2% and 6.1% respectively.
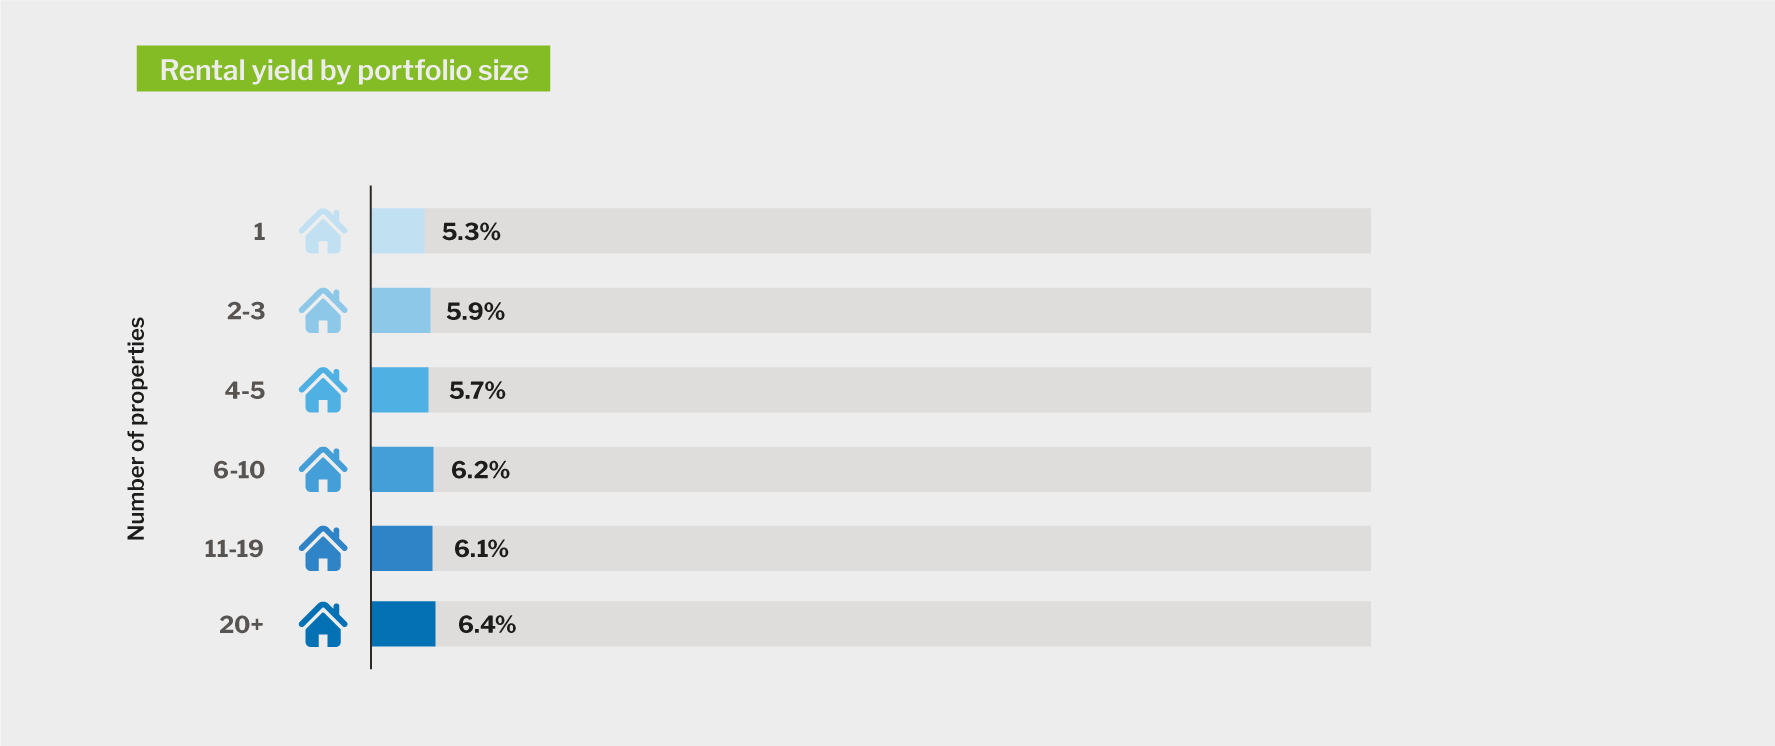
There continues to be a correlation between yields and portfolio sizes, with yields achieved generally increasing in line with the number of properties owned. Single property landlords generated average yields of 5.3% while those with 20 or more properties could expect to achieve yields of 6.4%.
Also consistent with previous quarters, the highest yields were generated with HMOs in Q3 2021, up from 6.8% last quarter to 7.2%.
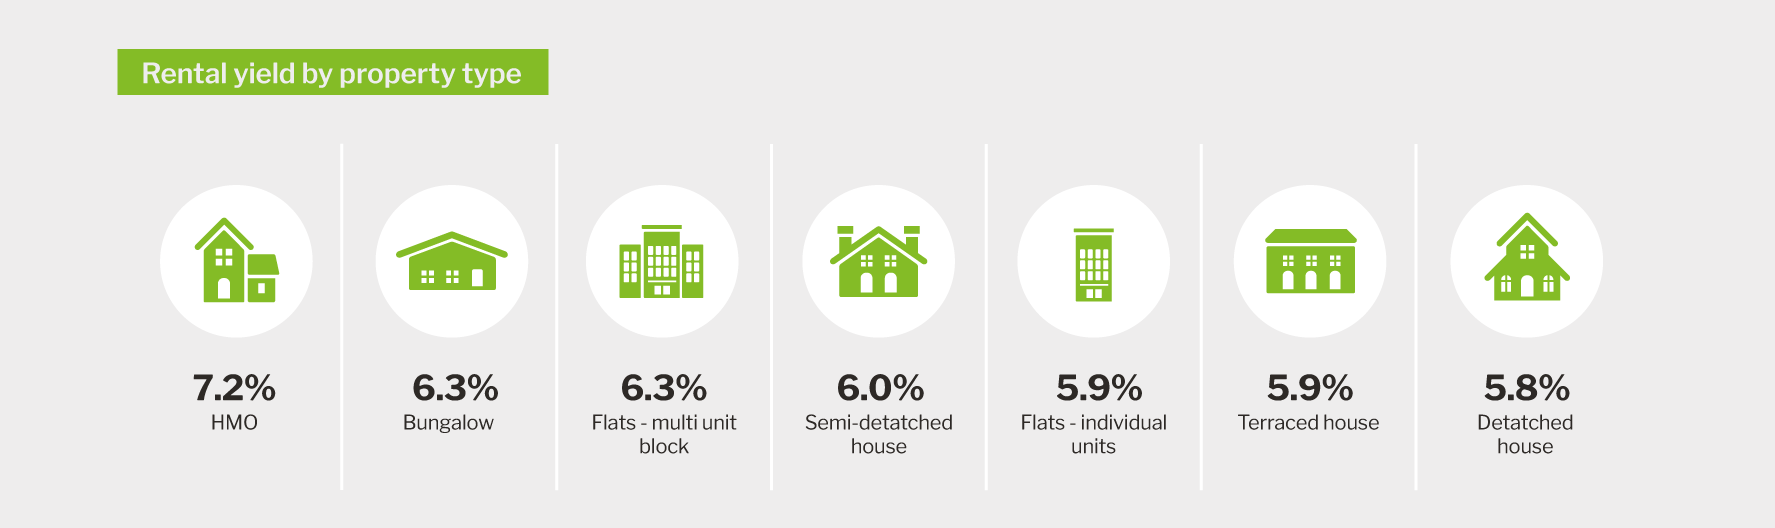
After landlords reported achieving yields of 5.5% with bungalows in Q2 2021, the lowest of any property type, the single-story houses have now returned as one of the highest performing investments with yields of 6.3% available.
Rent arrears
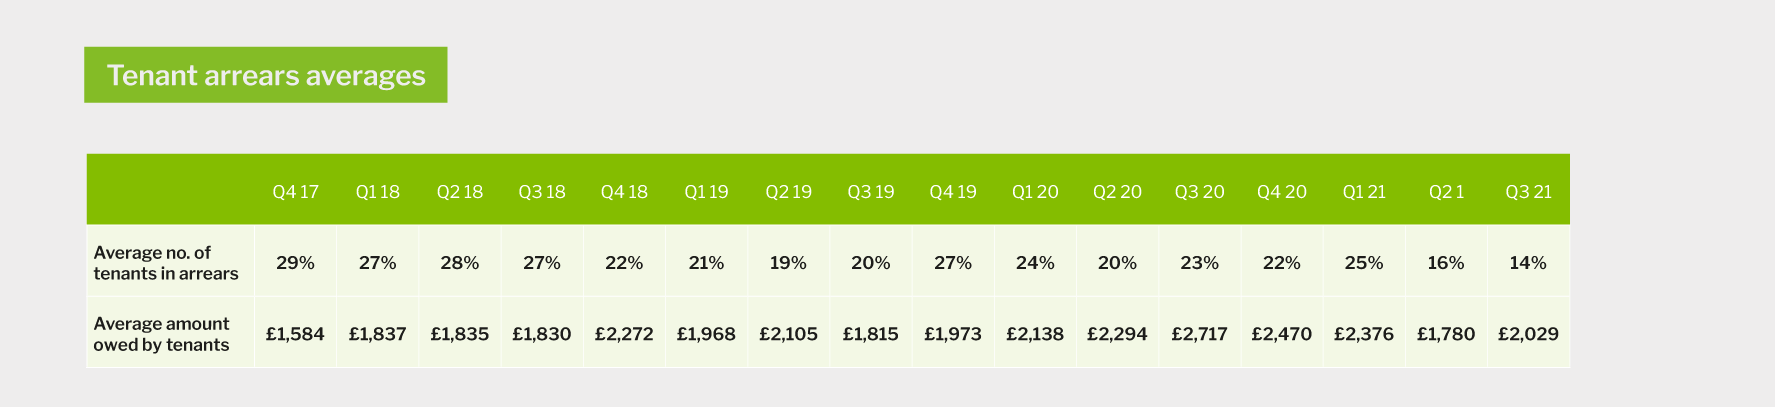
Last quarter saw the lowest number of tenants in arrears since tracking the metric started in Q1 2011. This has seen a slight increase from 1.3 tenants on average to 1.4.
The average value of rent owed by tenants has risen from Q2's 5-year low of £1,780 to £2,029, an increase of £248.
Profitability
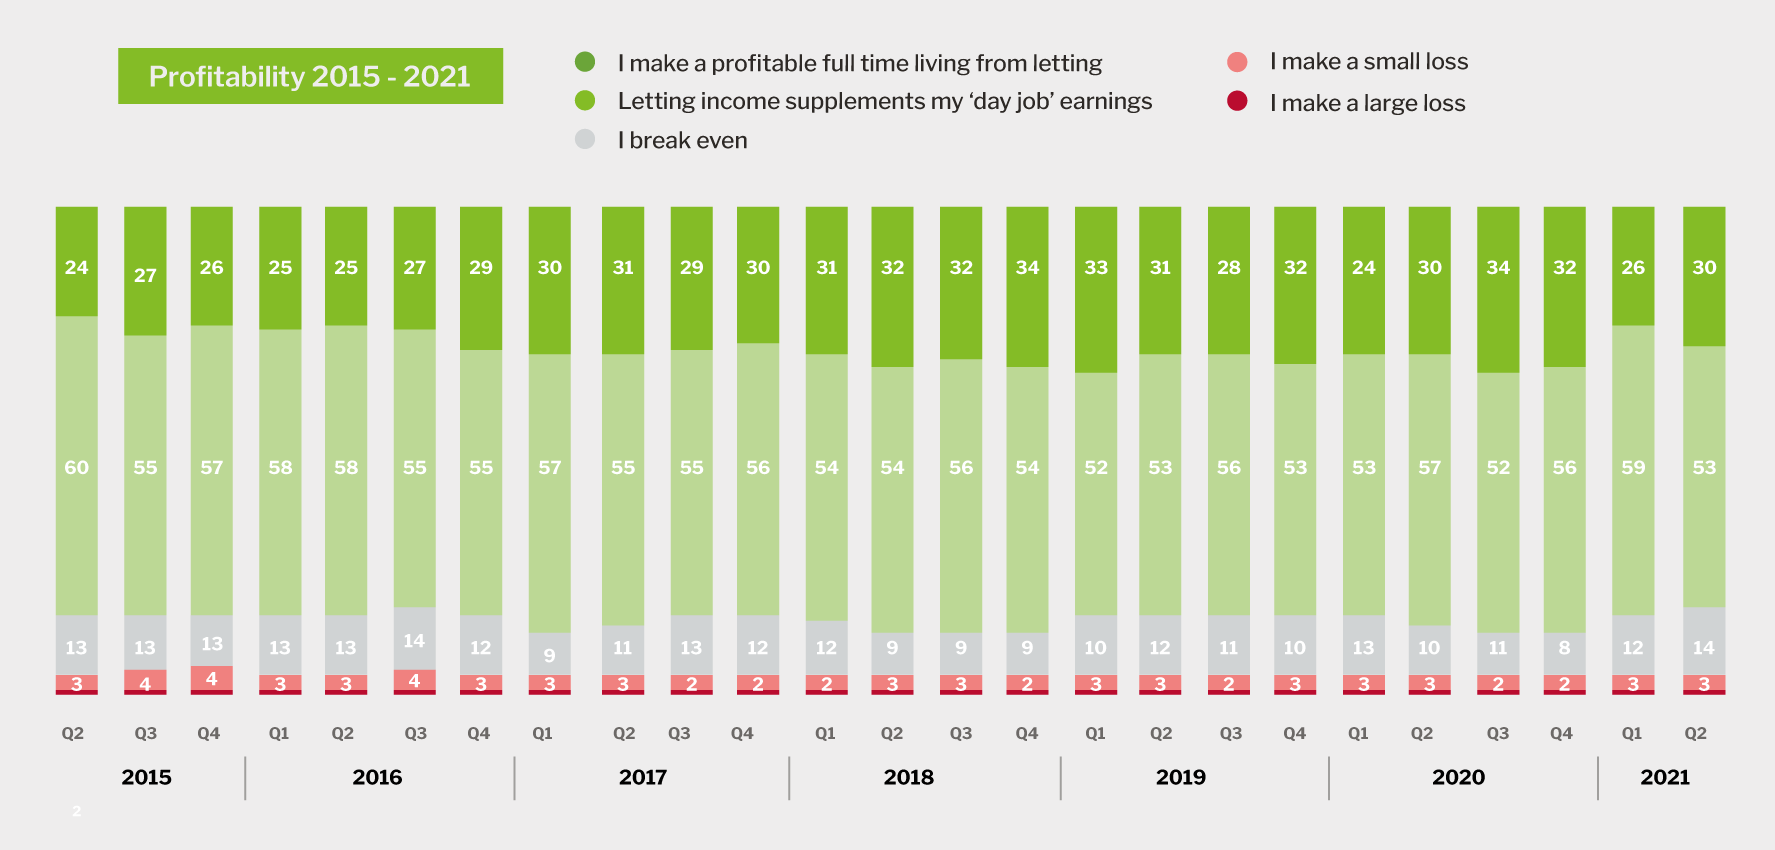
The proportion of landlords making a profit from their lettings activity is unchanged since the last quarter at 83%.
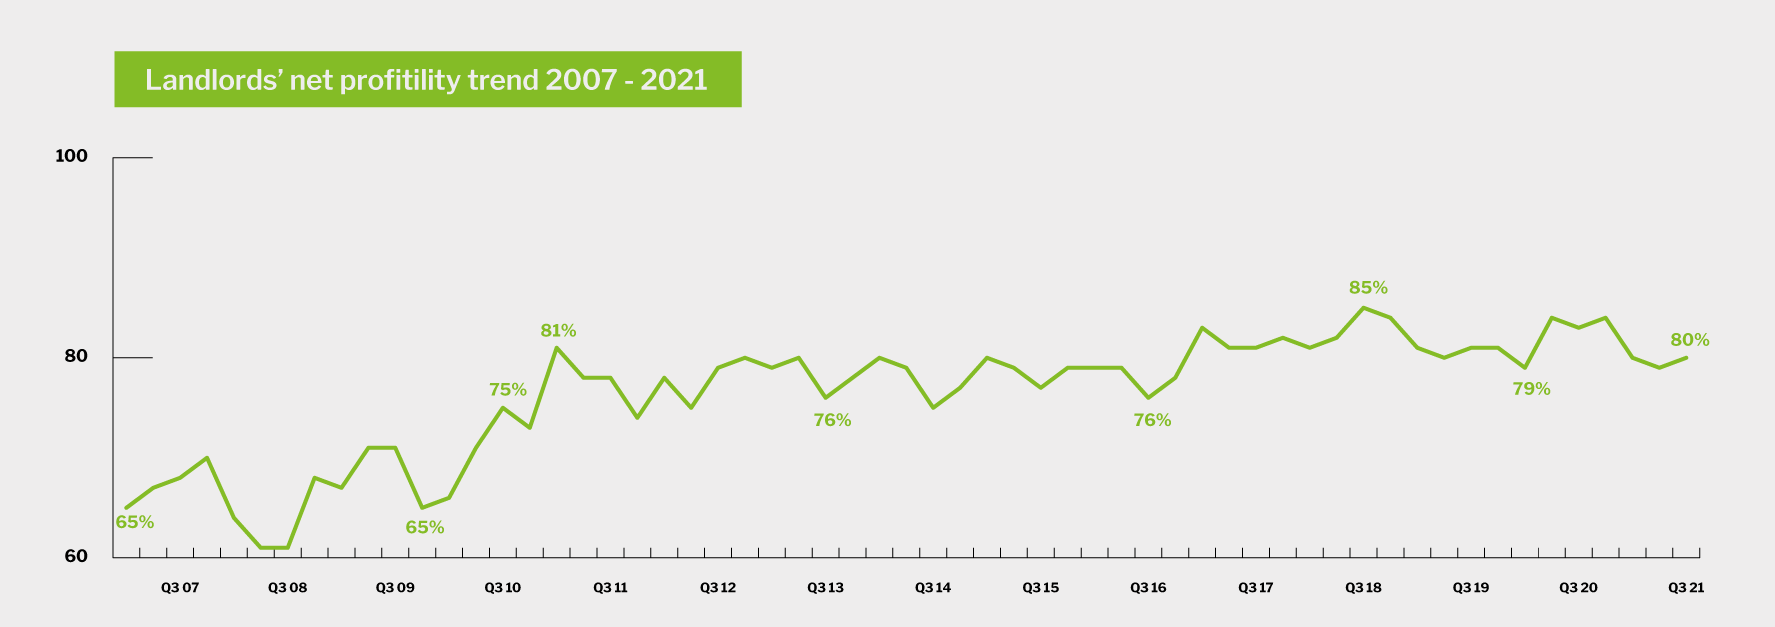
To calculate the overall profitability metric, the proportion of landlords who make a loss is subtracted from the proportion who make a profit. This has edged up by 1 percentage point since last quarter, with profitability throughout 2021 a little lower than the year before but broadly consistent with the longer-term trajectory.
Fewer landlords, -3 percentage points, said that they make a profitable full time living from letting, while the proportion that state that letting supplements their 'day job' has increased by 3 percentage points since Q2 2021.
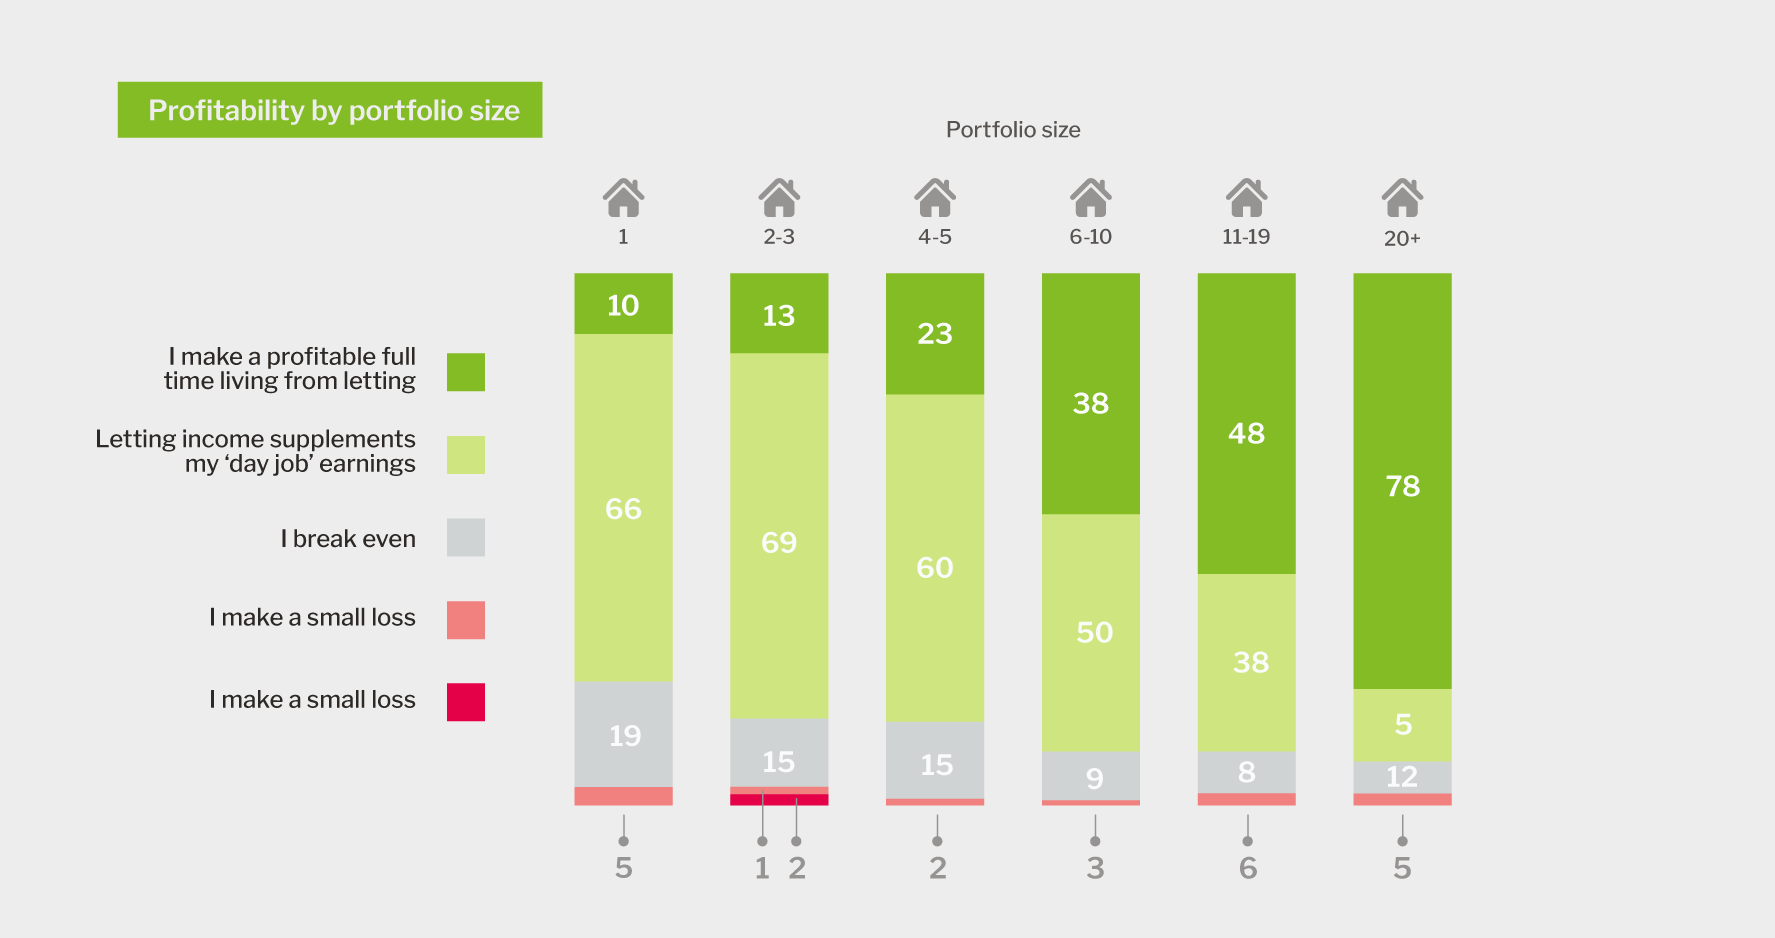
These figures are averaged across landlords of varying portfolio sizes and we see that the proportion making a full time living from letting increases with the number of properties owned.
Landlord business expectations
Strong tenant demand, combined with low levels of rent arrears and stable profitability, appears to have impacted landlord confidence which has increased year-on-year across all the key optimism indicators.
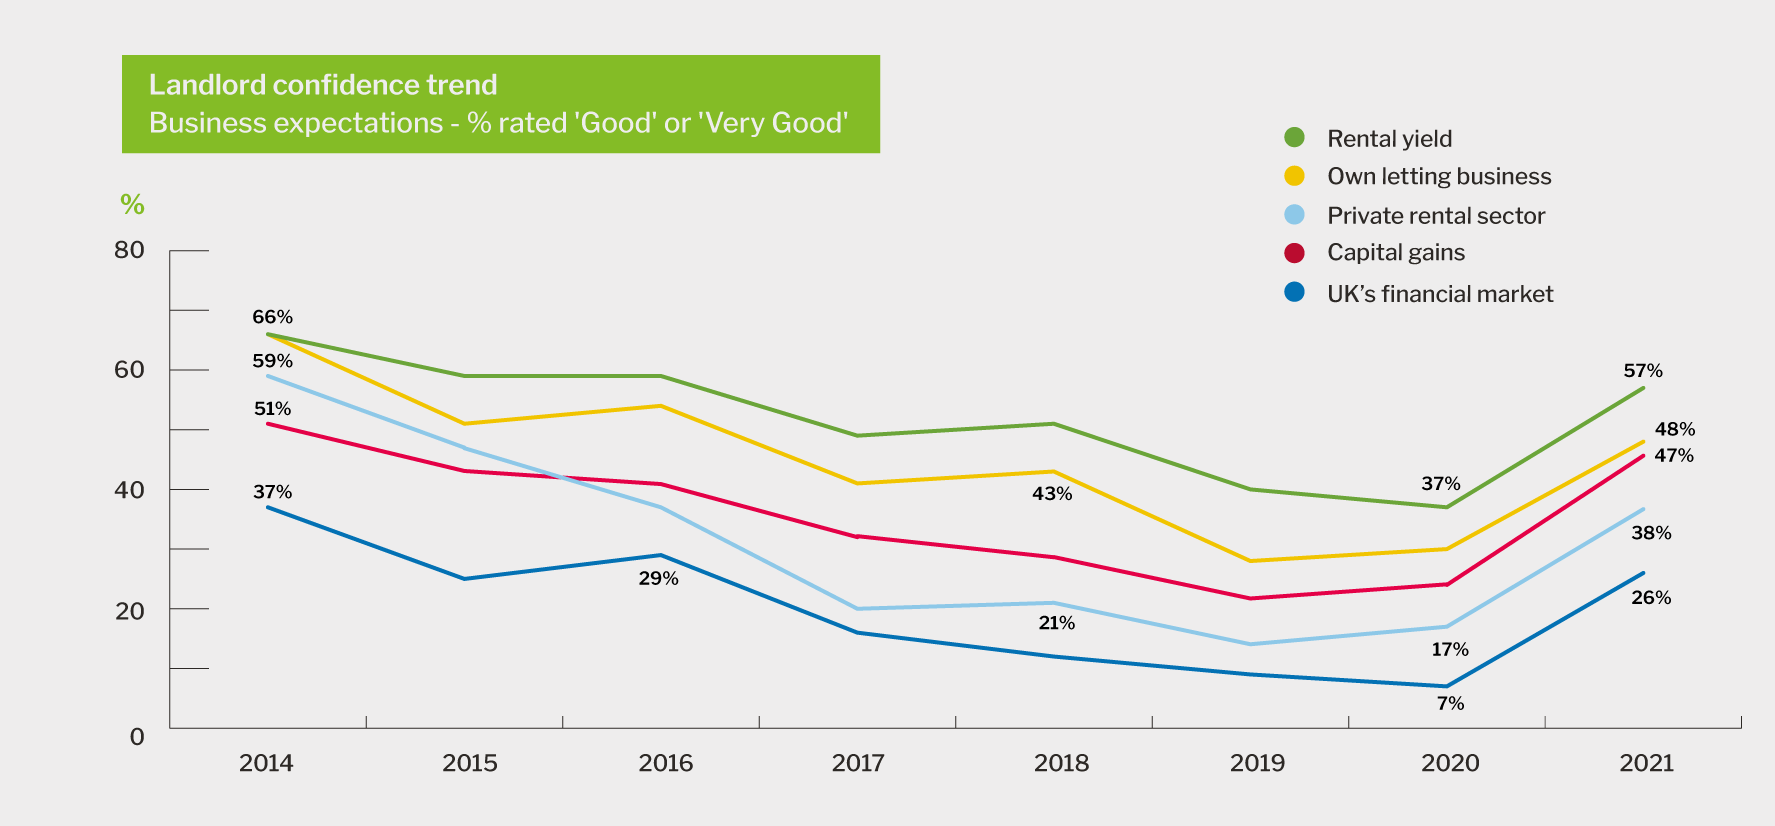
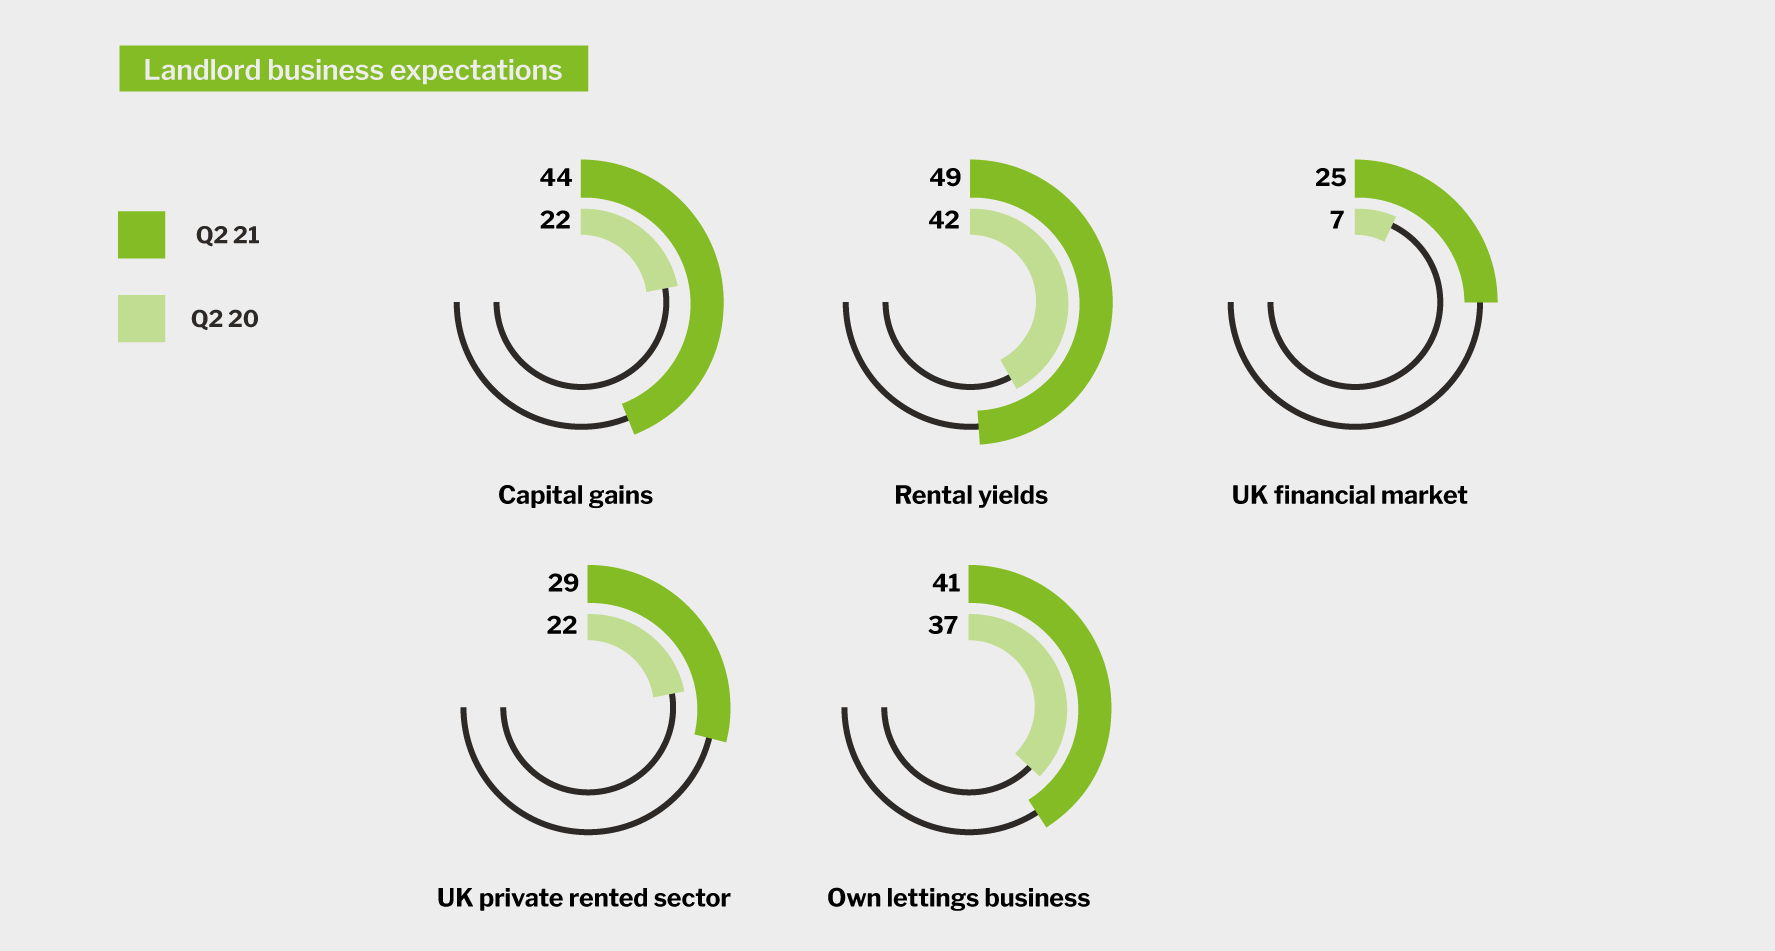
These metrics are generated by asking private rented sector (PRS) investors to rate five different aspects of letting - capital gain, rental yields, UK financial market, UK private rented sector and own lettings business. The proportion of landlords who said that they feel optimistic continues its upward trajectory, exceeding pre-Brexit and pre-pandemic levels to hit a 5-year high for each of these five key metrics.
Contributing to this are notable year-on-year increases in confidence in capital gains, up by 23%, and the UK private rental sector which an additional 21% of landlords feel optimistic about compared to Q3 2020.
Portfolio intentions
The proportion of landlords who indicated that they intend to sell property in the next 12 months has decreased from 20% in Q2 2021 to 19% in Q3. During the same time period, those that plan to expand their portfolios has grown from 14% to 19%, a return to the 4-year high level recorded at the start of the year.
Propensity to modify portfolios during the next year increases amongst landlords with 11 or more properties, with 33% looking to expand and 31% looking to divest.
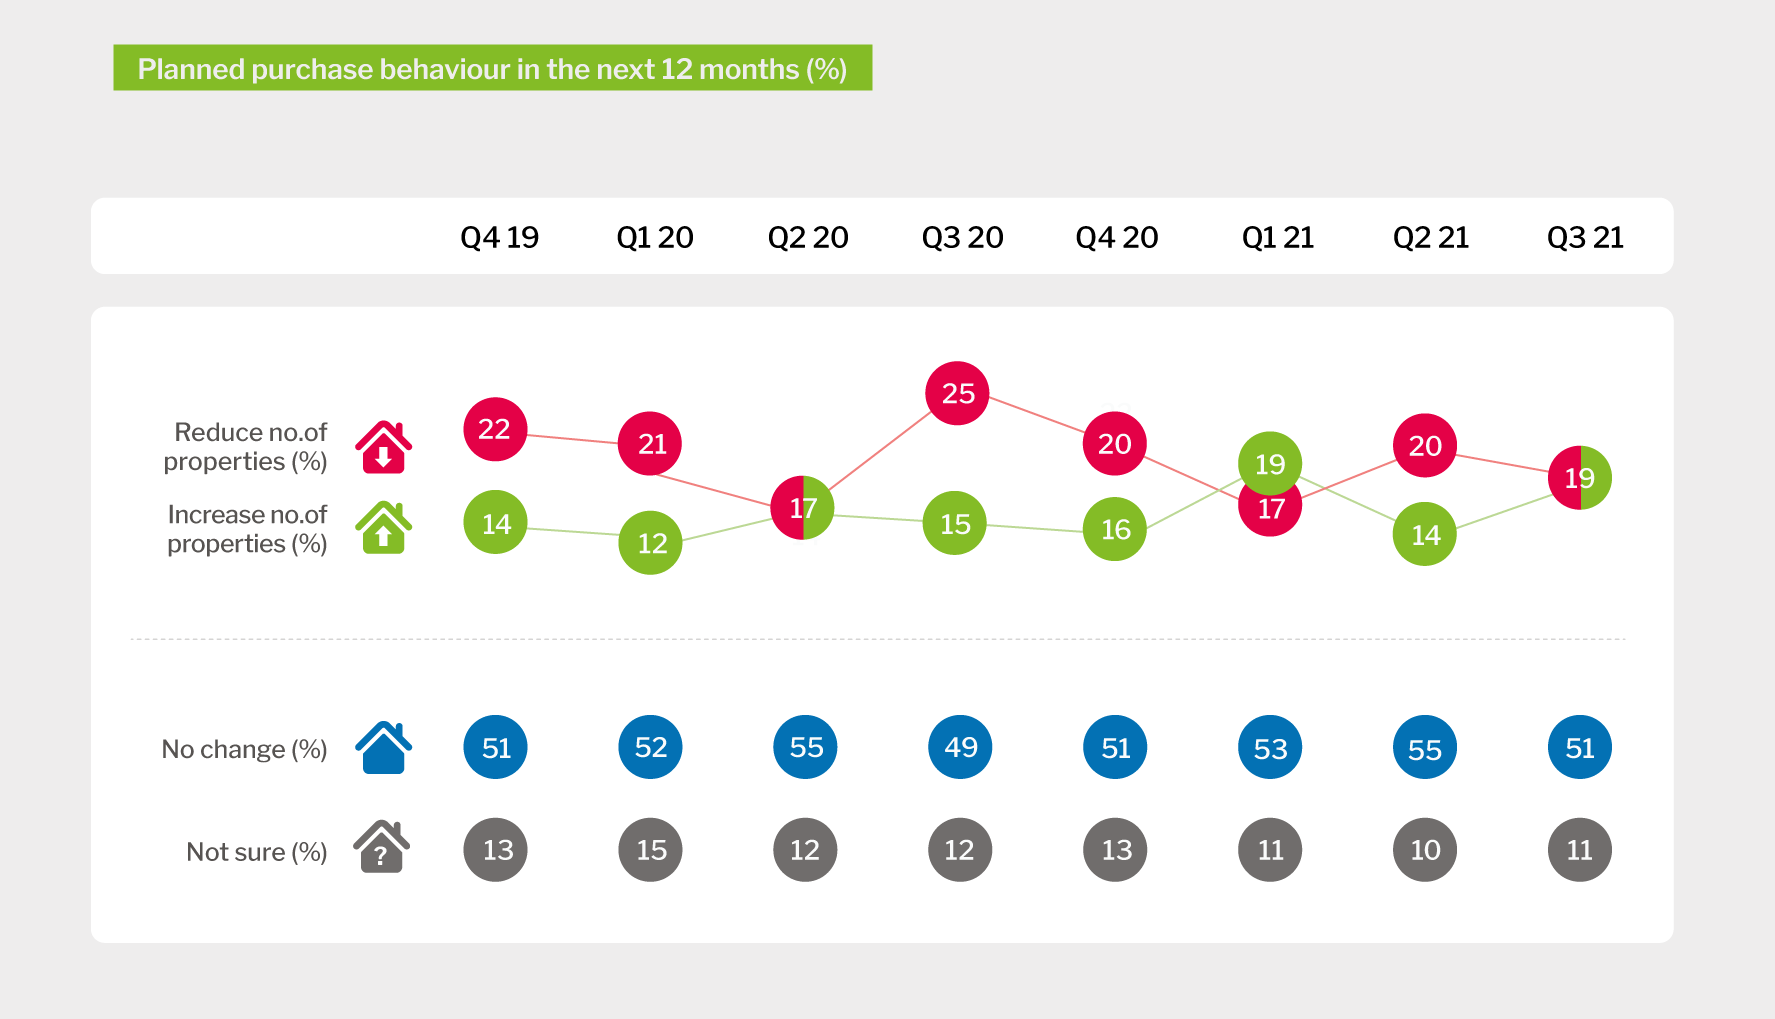
Similar to last quarter, those that plan on expanding their portfolios anticipate acquiring an average of 1.9 properties each and landlords who intend on reducing expect to sell an average of 2.0 properties.
Property purchase strategies
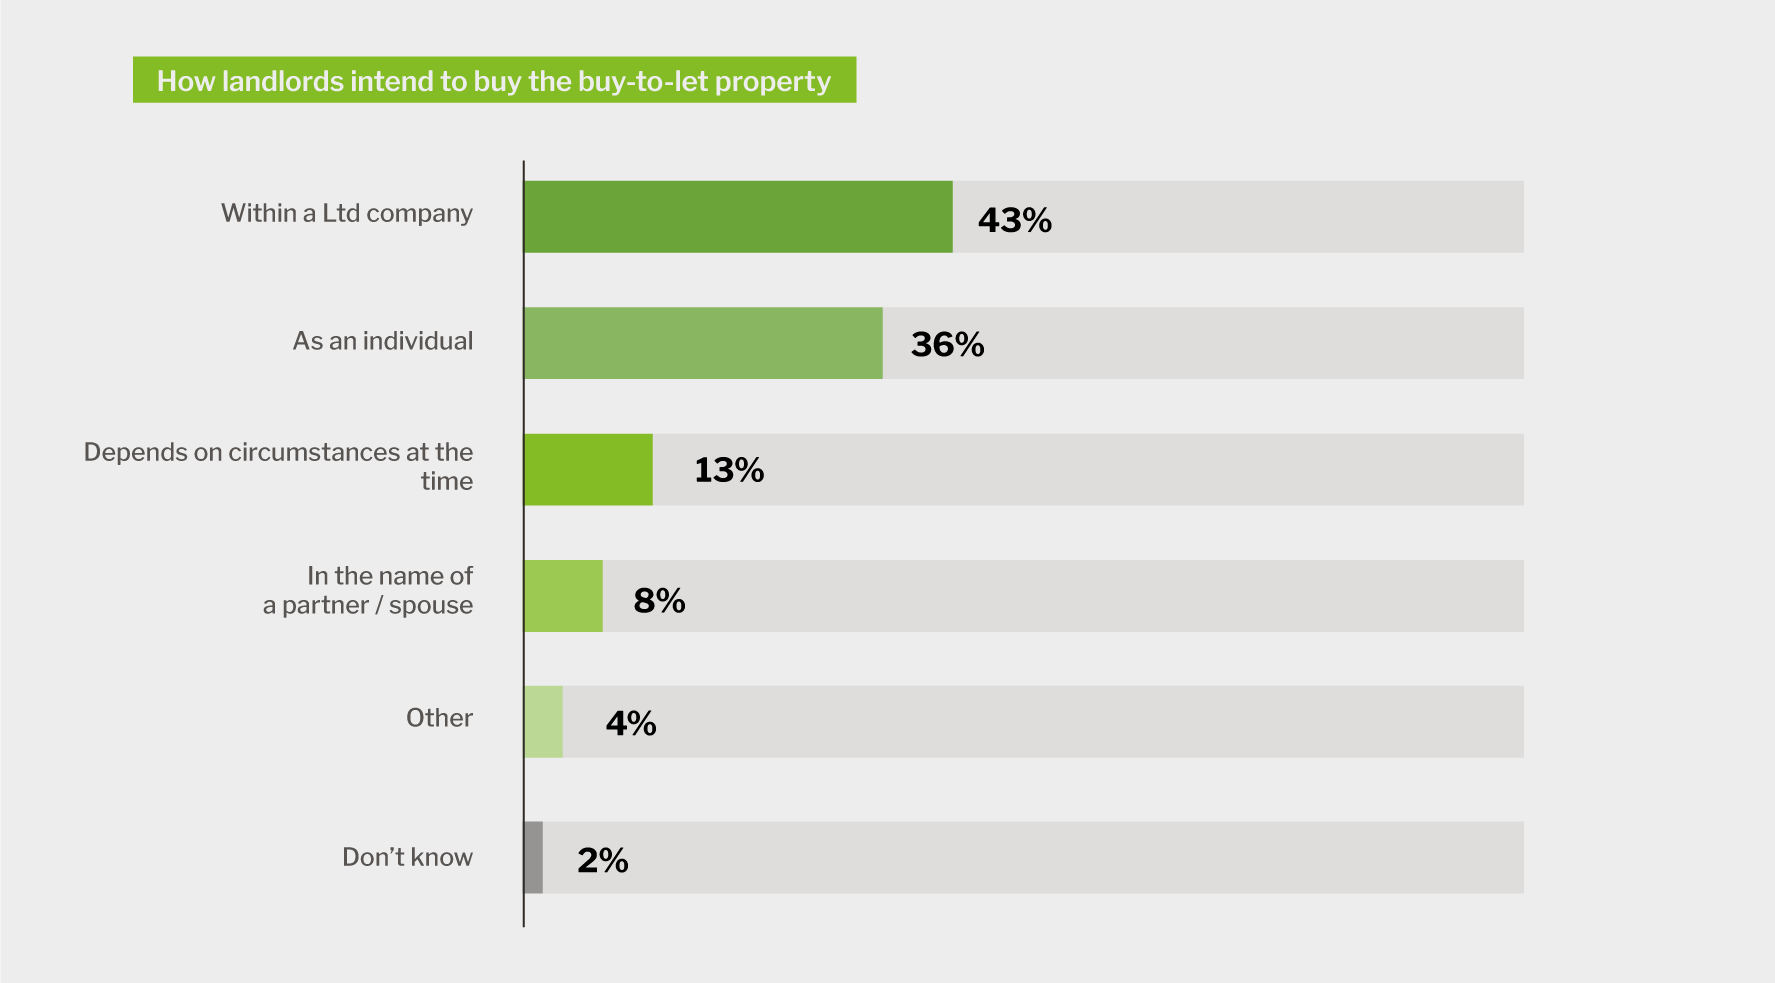
Property acquisitions are most likely to be made by landlords operating within a limited company structure (43%) or as individuals (36%).
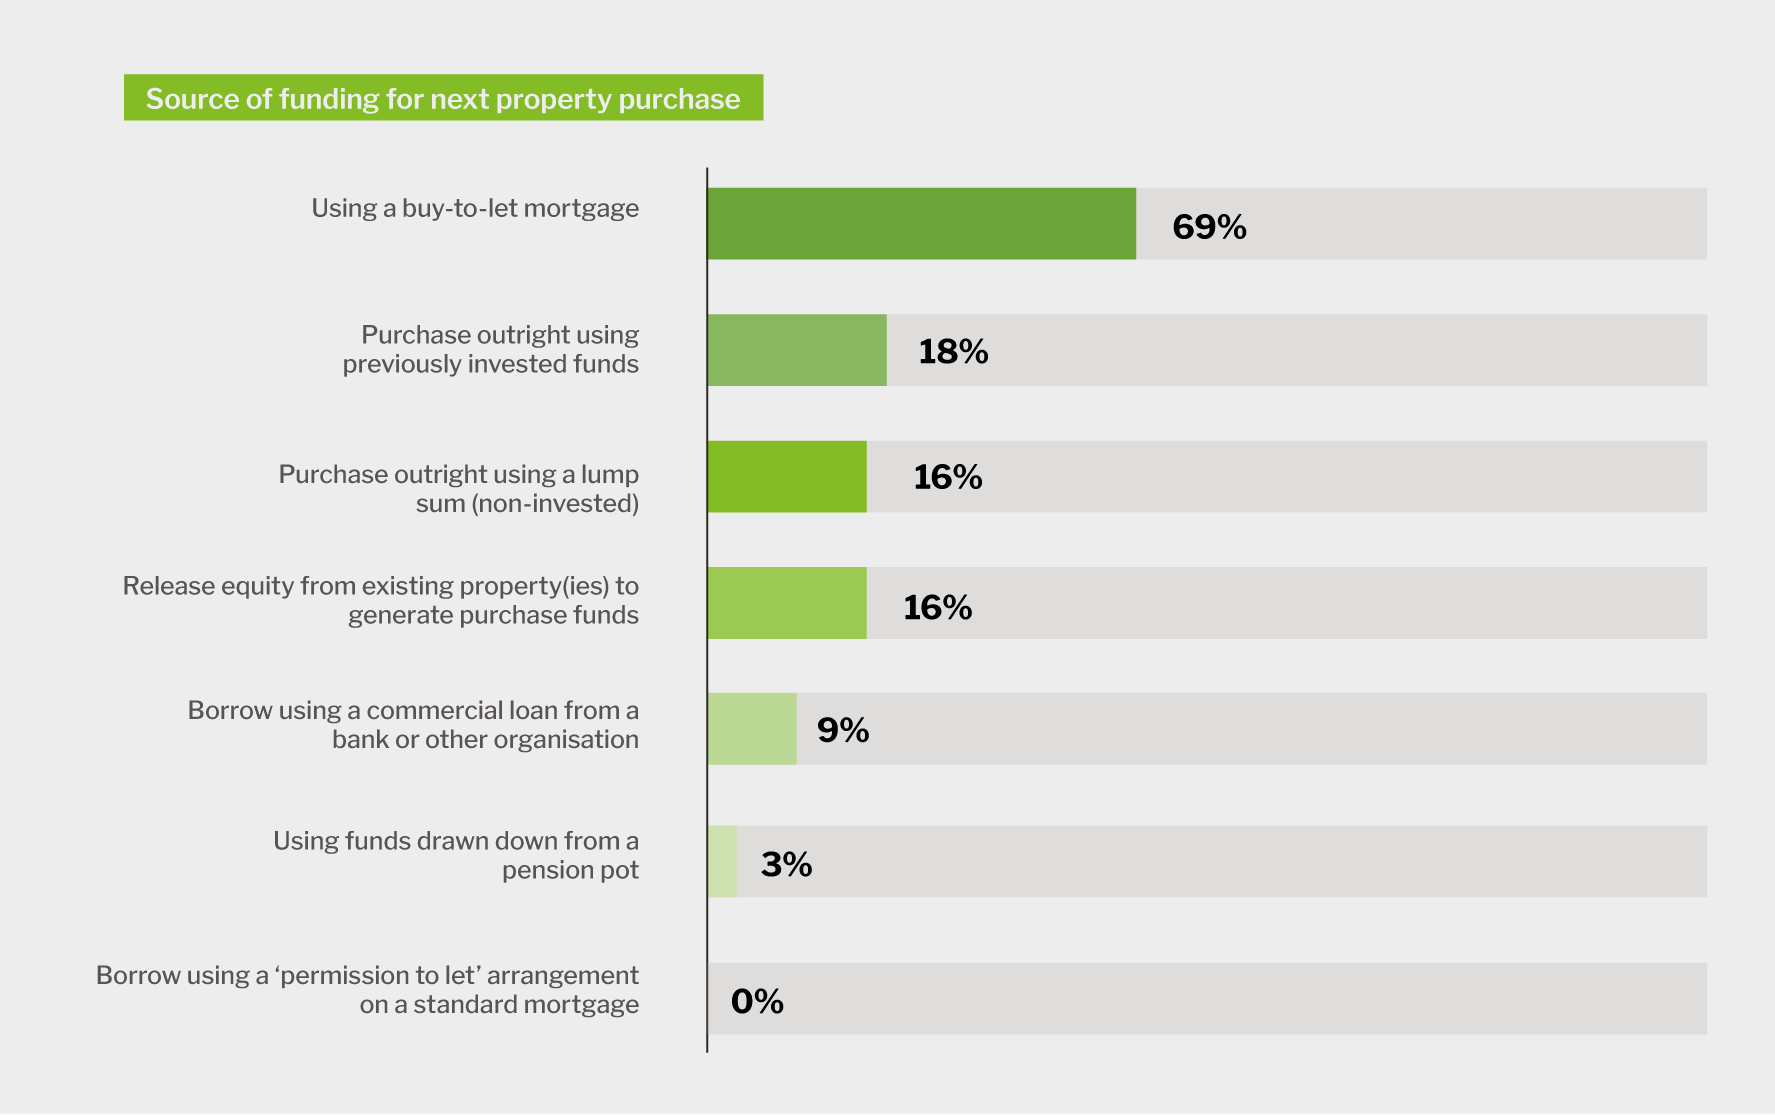
These are likely to be financed through buy-to-let lending in 69% of cases, up by six percentage points since Q2 2021. This is by far the most common source of funding for property purchases, with the second most popular being purchasing outright using previously invested funds, chosen by 18% of landlords.
Releasing equity from existing properties was the second most common source of funding for investors' next property purchase in Q2 2021 after an eight percentage points increase on the quarter before. This has now reversed, with 16% of landlords stating that they would utilise this finance method, making it the joint third most popular choice alongside purchasing outright using a non-invested lump sum.
The Q3 2021 Private Rented Sector (PRS) Trends report was developed following analysis of data gained through in-depth interviews with over 600 landlords. Research agency BVA BDRC, in partnership with the National Residential Landlords Association (NRLA), conducted these interviews in September 2021.